
IS WEAKER COMMERCIAL GRAPE PURCHASING BEING ACCOMPANIED BY WEAKER DEMAND FOR CALIFORNIA WINE?
Wine demand provides the downstream perspective on California’s wine-grape economy. While CWMI measures conditions in the grape market, shipment volume helps show whether changes in winery grape purchasing are occurring alongside changes in the physical volume of California wine moving into the U.S. market.
CURRENT MARKET SIGNAL
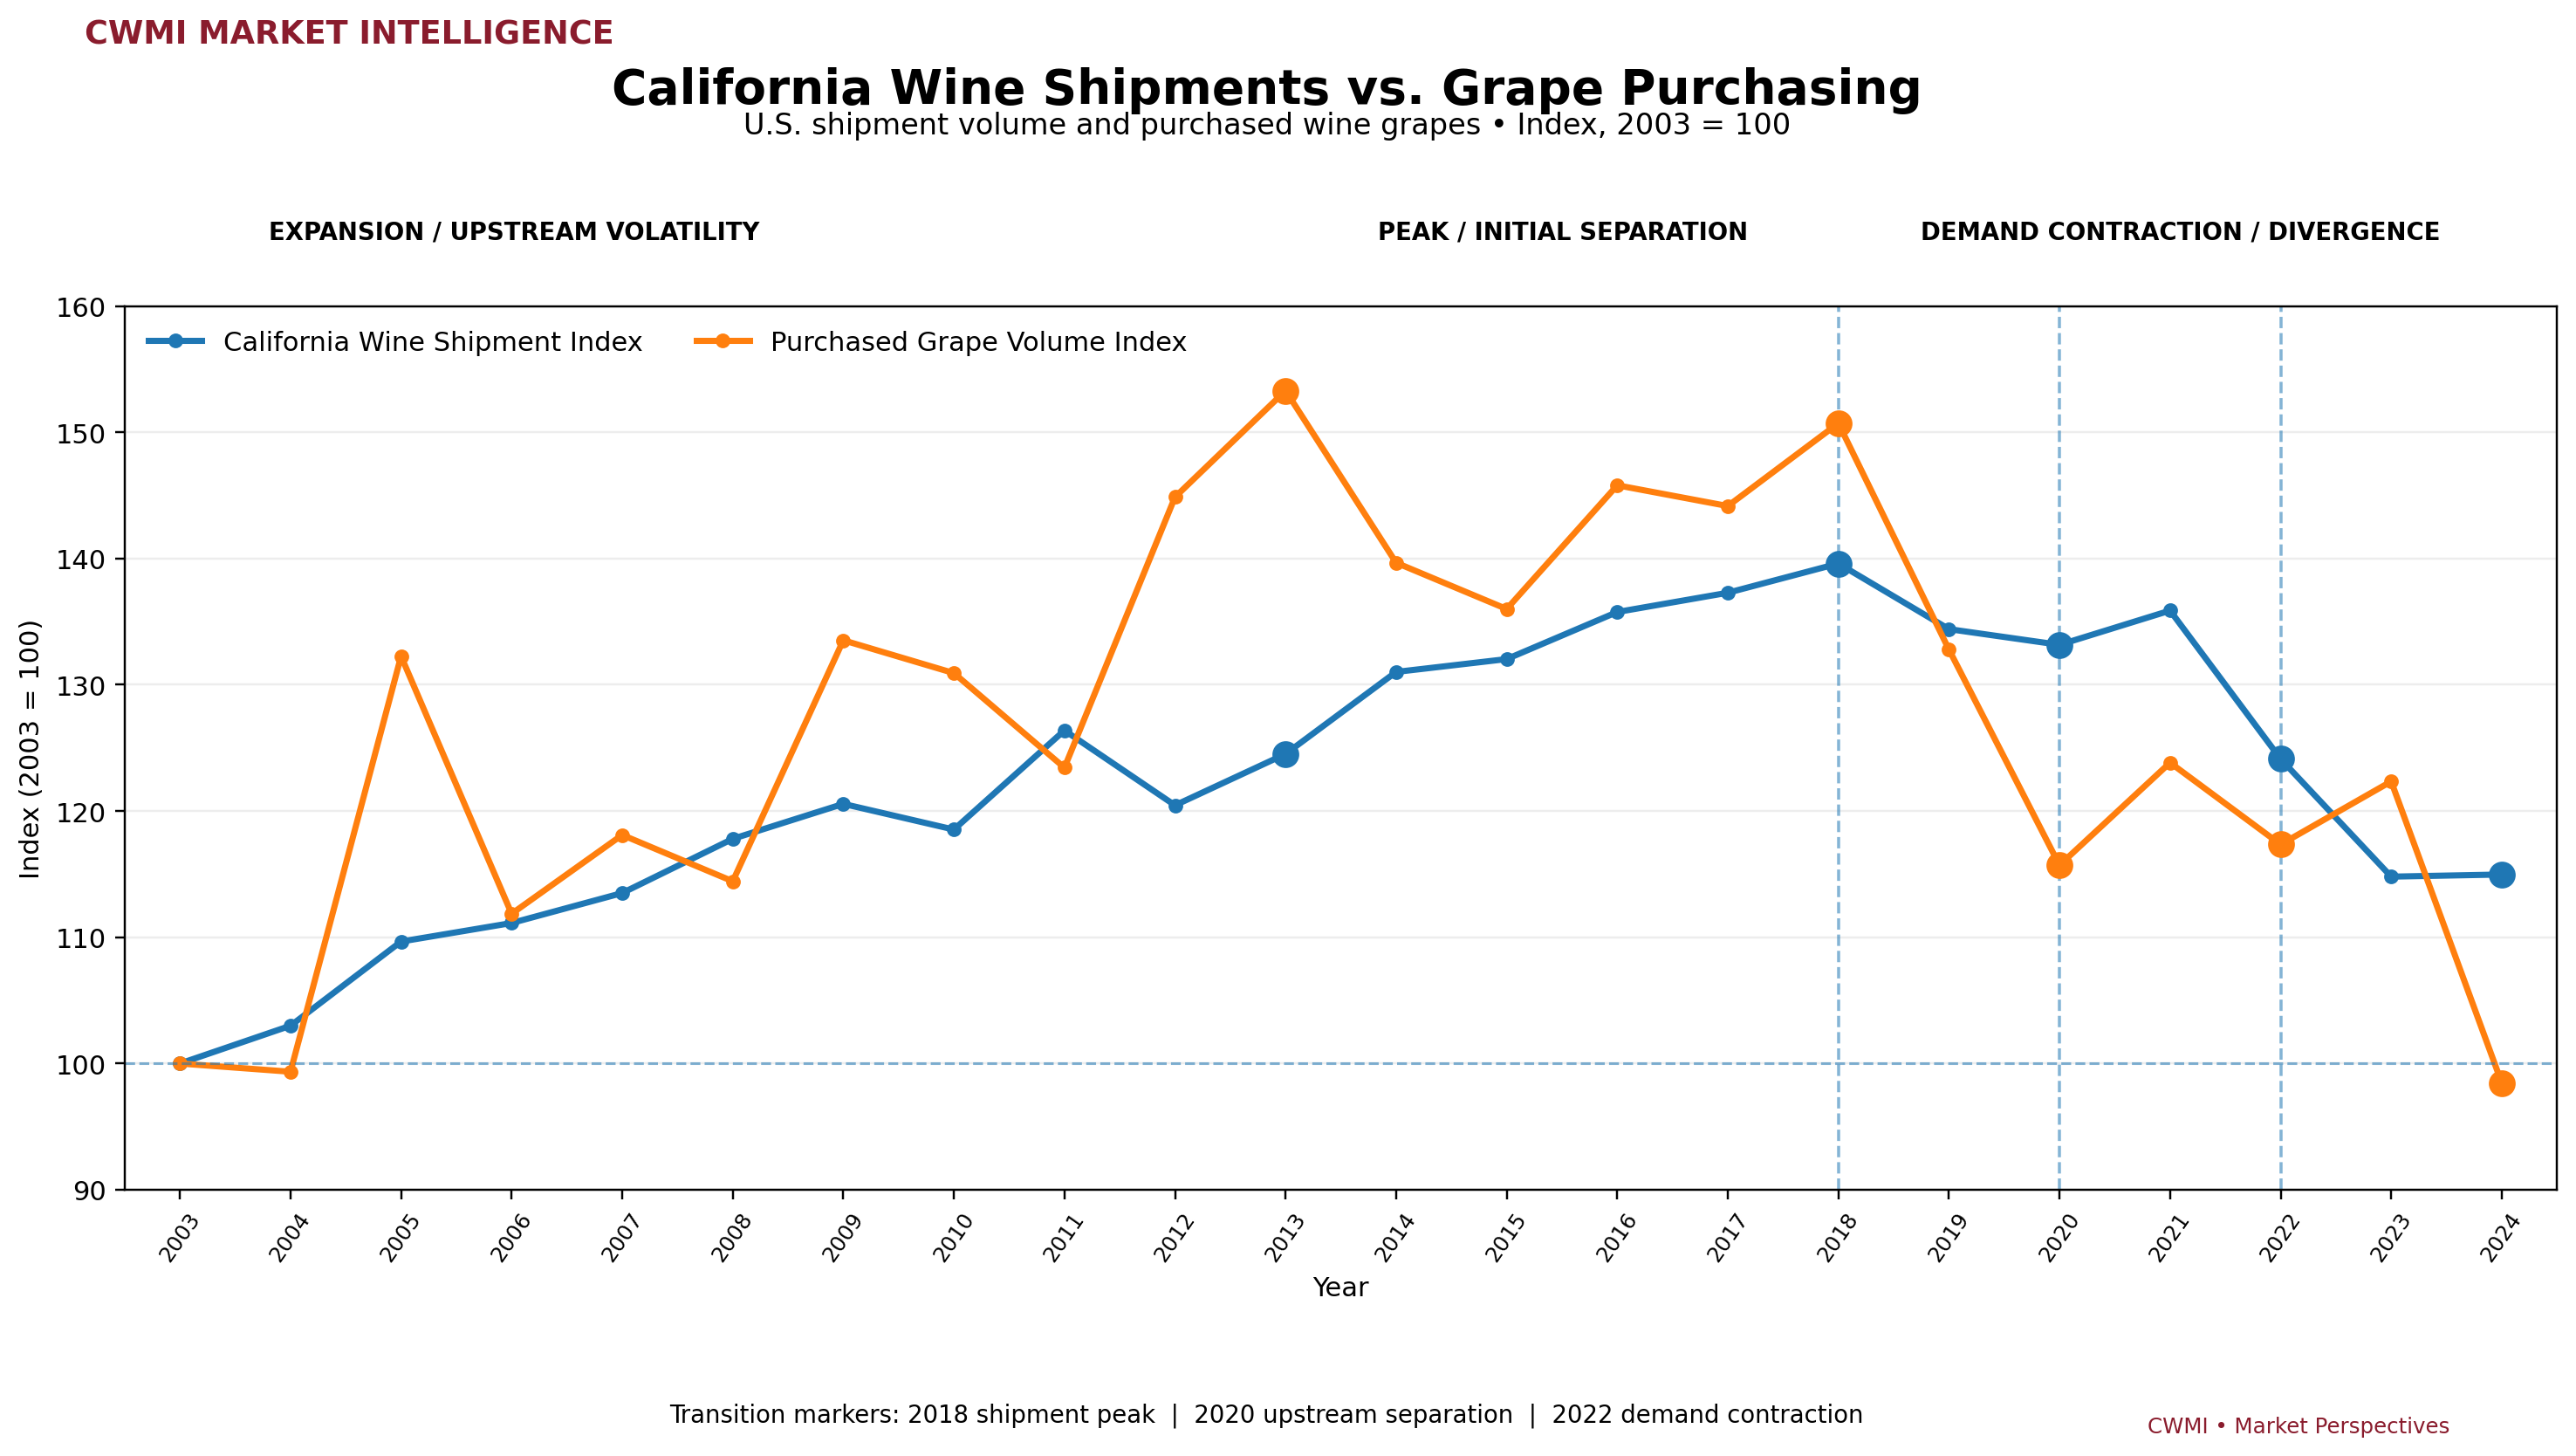
California wine shipments to the U.S. totaled 203.5 million 9-liter cases in 2024, essentially unchanged from 2023 but 17.6% below the 2018 peak of 247.1 million cases. Over the same period, California wineries’ purchased grape volume has weakened more sharply, indicating that upstream grape purchasing is adjusting faster than downstream wine shipments.
SIGNAL: WEAKENING
THE TAKEAWAY
California wine demand is showing a sustained volume contraction rather than a simple one-year decline. Domestic shipment volume peaked in 2018 and remains materially below that level. At the same time, purchased grape volume has fallen faster and with considerably greater volatility, suggesting that the adjustment occurring upstream in the grape market is more severe than the decline visible in finished-wine shipments.
The divergence matters because wine shipments and grape purchasing operate at different points in the supply chain. Inventory, production timing, sourcing decisions, imports, exports, and changes in wine style or product mix can delay or amplify the transmission of weaker consumer demand back to California growers.
HISTORICAL PERSPECTIVE
California Wine Shipments vs. Grape Purchasing — 2003–2024
Both series are independently indexed to 2003 = 100, allowing downstream wine shipment volume and upstream purchased grape volume to be compared on the same scale.
WHY IT MATTERS
Wine shipments provide an important downstream check on conditions observed in the grape market. When finished-wine shipment volume weakens, wineries may respond through inventory management, reduced production, changes in sourcing, or lower grape purchases. Those adjustments can eventually transmit weaker market conditions back to growers.
The current evidence suggests that this transmission is not occurring evenly. California wine shipment volume has declined from its 2018 peak, while purchased grape volume has contracted more sharply. For CWMI, that divergence helps distinguish a broad weakening in wine demand from the more severe adjustment occurring within the California grape market.
CWMI INTERPRETATION: Downstream demand is weakening, while upstream grape purchasing is adjusting faster.
WHAT TO WATCH
CWMI will monitor three signals to determine whether California wine demand is stabilizing or continuing to weaken:
- California Wine Shipments — Is physical case volume stabilizing, recovering, or continuing to decline?
- Purchased Grape Volume — Are wineries increasing or reducing their purchases of California wine grapes?
- Shipment–Purchase Gap — Are downstream wine shipments and upstream grape purchasing moving back toward alignment or separating further?
A stabilization in wine shipments accompanied by recovering grape purchases would provide evidence that pressure within the supply chain is beginning to ease. Continued shipment weakness combined with declining grape purchases would reinforce the signal of persistent market contraction.
METHODOLOGY & SOURCES
California Wine Shipments
CWMI uses California wine shipments to the U.S. market, measured in millions of 9-liter cases, as its primary downstream volume indicator. Shipment volume measures physical wine movement rather than retail dollar value, helping separate changes in market volume from changes caused by pricing or product mix.
Purchased Grape Volume
Purchased volume represents wine grapes purchased by California processors as reported through the California Grape Crush Report. CWMI uses purchased tons to represent commercial winery buying activity in the California grape market.
Index Construction
Both series are independently indexed to 2003 = 100. The comparison begins in 2003 because this is the first year in the currently published California shipment series used for this analysis. The Shipment–Purchase Gap measures the difference between the two indexed series; it is an analytical comparison, not a claim that one series directly causes movements in the other.
Primary Sources
Wine Institute, California wine shipment statistics, with underlying shipment data attributed to bw166/Gomberg-Fredrikson & Associates; California Department of Food and Agriculture, California Grape Crush Reports.
METHODOLOGY & SOURCES
California Wine Shipments
CWMI uses California wine shipments to the U.S. market, measured in millions of 9-liter cases, as its primary downstream volume indicator. Shipment volume measures physical wine movement rather than retail dollar value, helping separate changes in market volume from changes caused by pricing or product mix.
Purchased Grape Volume
Purchased volume represents wine grapes purchased by California processors as reported through the California Grape Crush Report. CWMI uses purchased tons to represent commercial winery buying activity in the California grape market.
Index Construction
Both series are independently indexed to 2003 = 100. The comparison begins in 2003 because this is the first year in the currently published California shipment series used for this analysis. The Shipment–Purchase Gap measures the difference between the two indexed series; it is an analytical comparison and does not imply that movements in one series directly cause movements in the other.
Primary Sources
Wine Institute, California wine shipment statistics, with underlying shipment data attributed to bw166/Gomberg-Fredrikson & Associates; California Department of Food and Agriculture (CDFA), California Grape Crush Reports.
Return to the California Wine Market Index™ for the current statewide market signal, key indicators, and additional Market Perspectives.
 California Wine Index