
CURRENT EVIDENCE
BEARING ACREAGE
510,000 acres
−5.6% YoY
2025 estimated productive wine-grape acreage
THE TAKEAWAY
HISTORICAL PERSPECTIVE
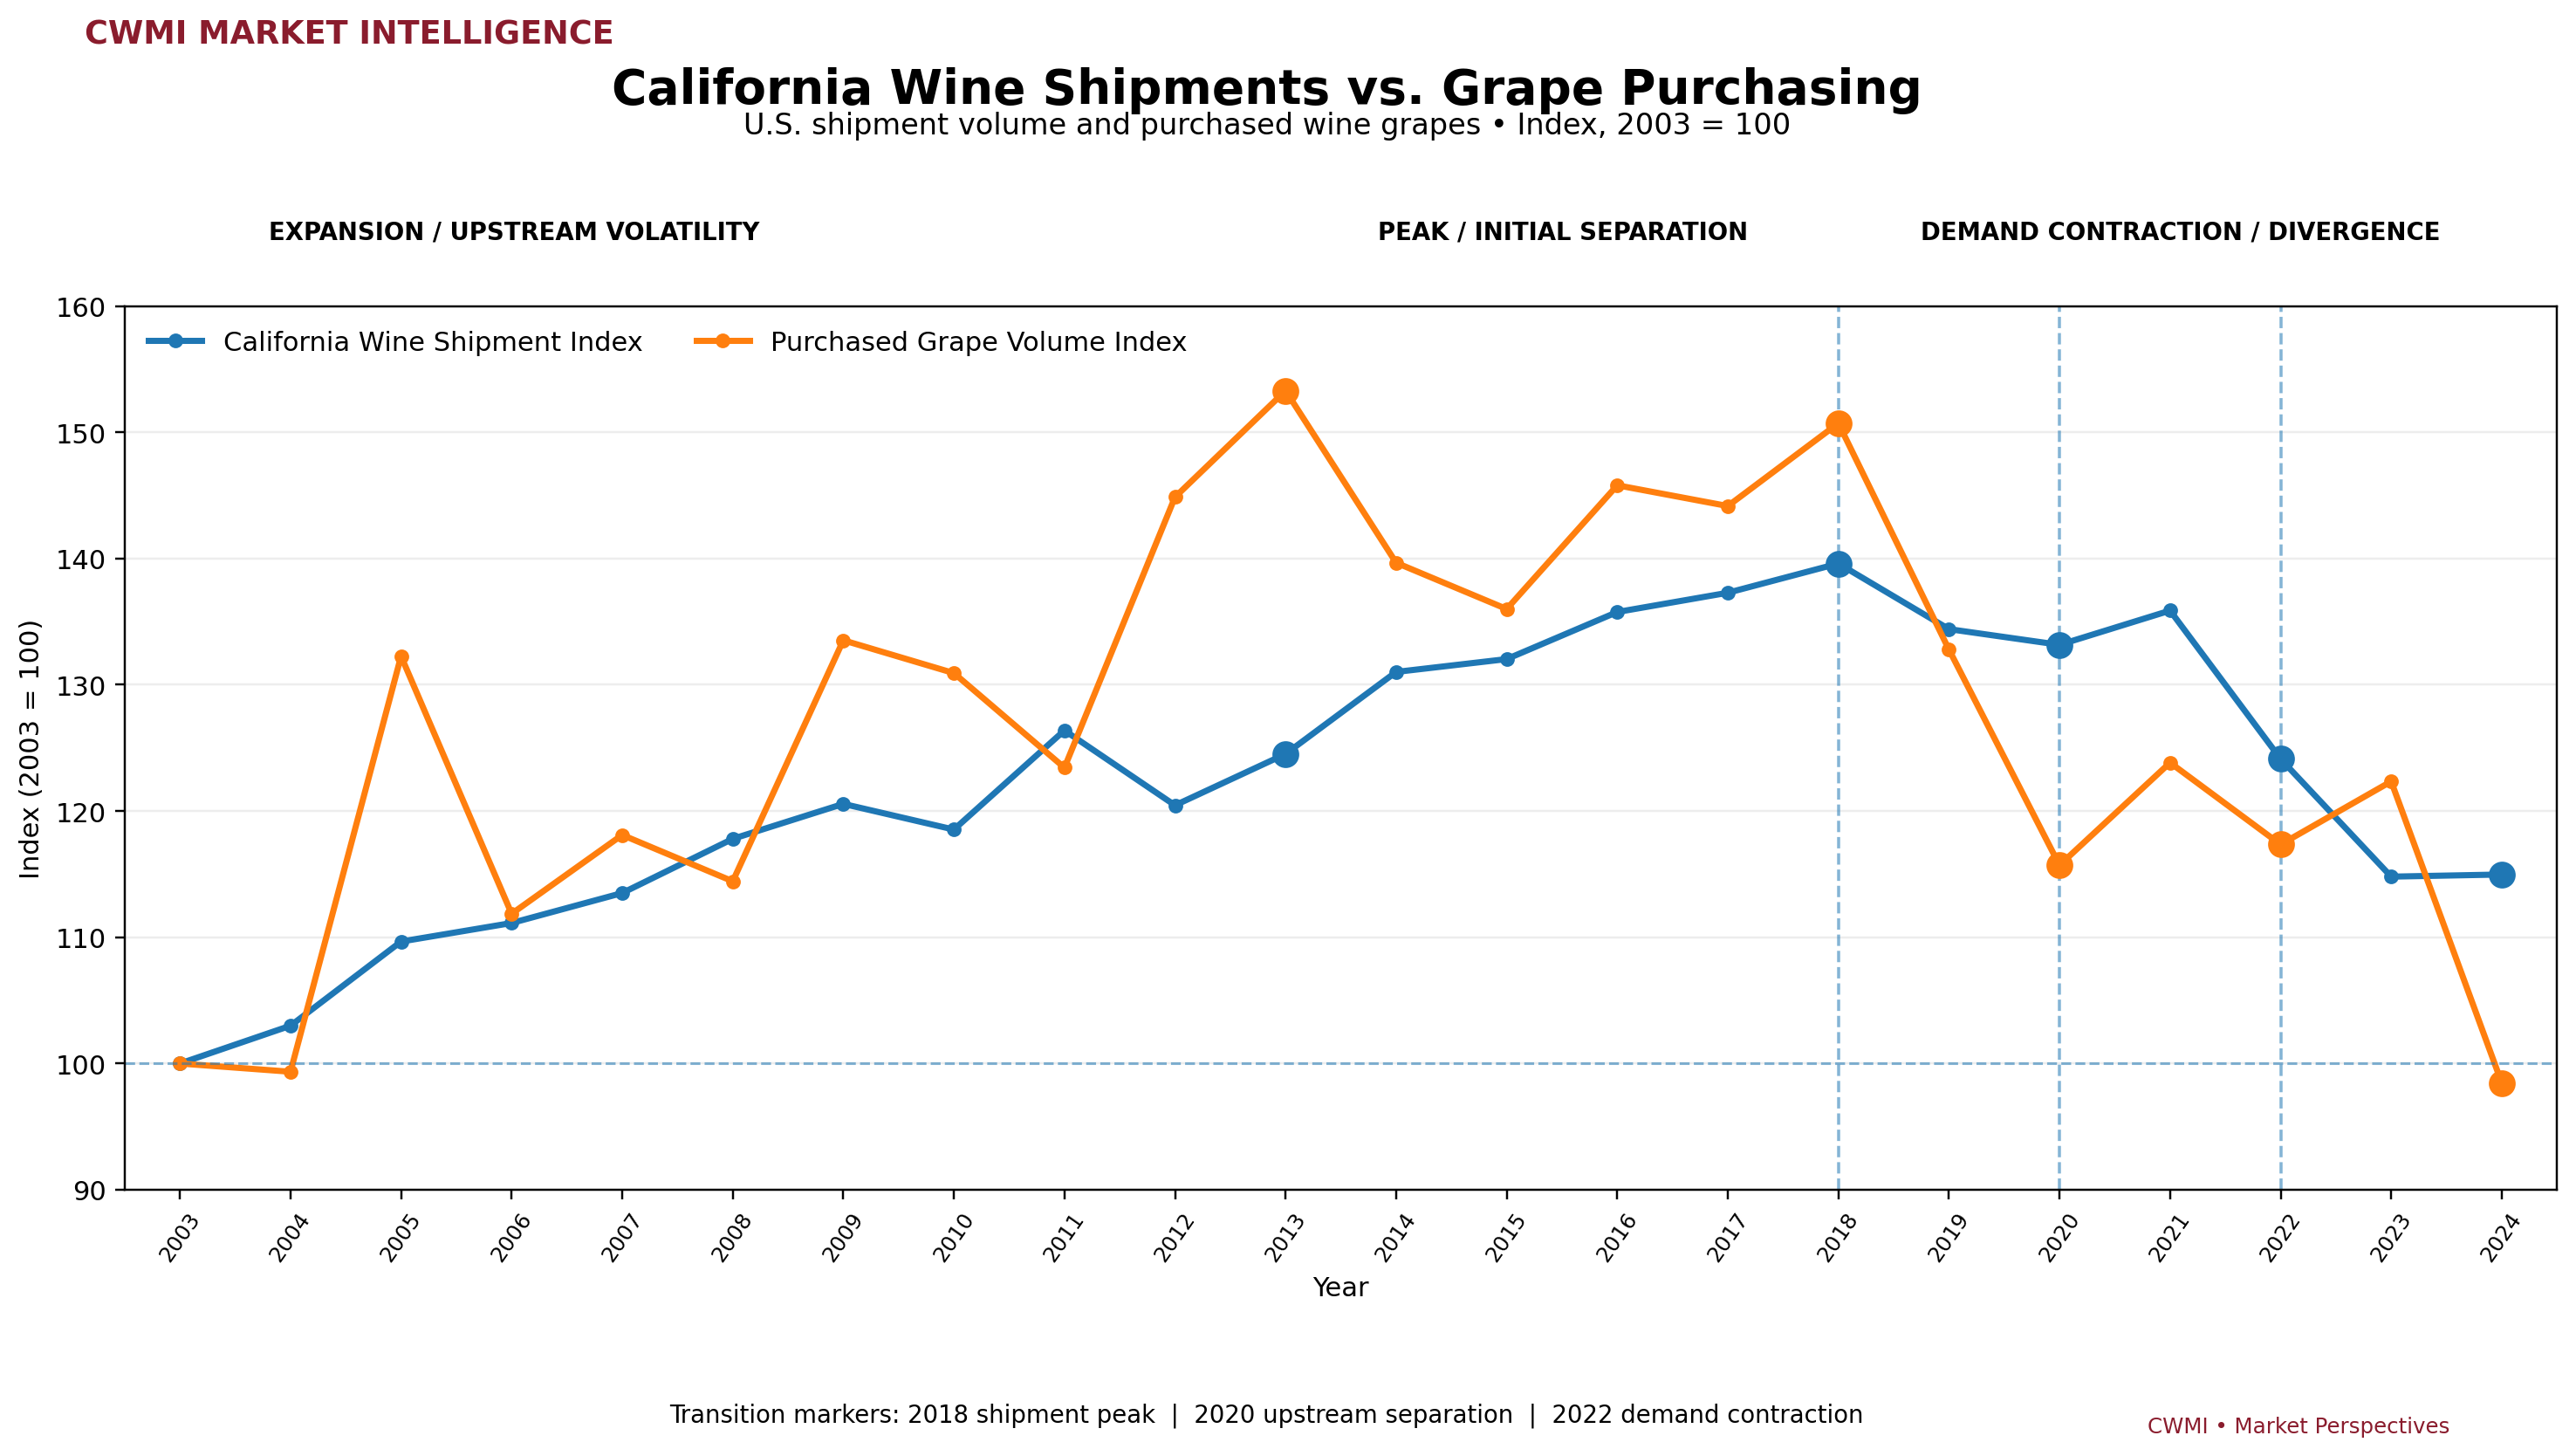
Bearing Acreage vs. Purchased Volume — 2000–2025
Both series are indexed to 2000 = 100 so their relative movement can be compared directly.
WHAT THE CHART TELLS US
California’s productive vineyard acreage and commercial grape purchasing moved relatively closely through much of the previous market cycle. The relationship began to separate materially after 2018. By 2025, the Bearing Acreage Index stood at 111.35 while the Purchased Volume Index had fallen to 71.55—a gap of nearly 40 index points.
The evidence indicates that vineyard acreage is now contracting, but the productive vineyard footprint has not adjusted as quickly as commercial purchasing. This continuing separation is an important measure of California wine-grape market imbalance.
WHY IT MATTERS
When productive vineyard acreage remains elevated relative to commercial grape purchasing, pressure can extend beyond a single harvest. Growers may face fewer buyers and greater difficulty placing fruit, while wineries can operate in a market with greater sourcing flexibility. Continued vineyard removals can help narrow that imbalance, but acreage adjustment takes time.
For CWMI, bearing acreage therefore serves as a supply-side indicator—not a component of the index itself. Its value is in showing whether California’s productive vineyard base is adjusting toward the level of commercial demand reflected in purchased grape volume.
WHAT TO WATCH
The next phase of California’s vineyard adjustment will depend on whether productive acreage continues to decline and whether commercial grape purchasing begins to stabilize. CWMI will watch three signals:
Bearing Acreage — Are vineyard removals reducing productive capacity?
Purchased Volume — Is winery buying stabilizing, recovering, or continuing to contract?
The Acreage–Volume Gap — Is the difference between productive capacity and commercial purchasing narrowing or widening?
A narrowing gap would suggest that vineyard capacity and commercial demand are moving back toward alignment. A widening gap would indicate continued market imbalance.
California’s vineyard footprint is beginning to adjust to weaker commercial demand. But in 2025, purchased grape volume contracted about 2.5 times faster than bearing acreage, suggesting that productive capacity has not yet adjusted as quickly as buyer activity.
PURCHASED VOLUME
1.96 million tons
−13.9% YoY
California wineries purchased approximately 1.96 million tons of wine grapes in 2025, down 13.9% from the prior year. Because CWMI uses purchased tons as its measure of commercial winery buying activity, the decline indicates a substantial contraction in demand for grower-supplied grapes.
CWMI INTERPRETATION: Winery purchasing is contracting faster than vineyard capacity, reinforcing the current market-pressure signal.The sharp decline in purchased volume indicates continued contraction in winery grape demand and reinforces the current market-pressure signal.
IS CALIFORNIA’S VINEYARD FOOTPRINT ADJUSTING TO WEAKER COMMERCIAL DEMAND?
California’s productive wine-grape acreage is contracting—but commercial grape purchasing is contracting considerably faster.
Return to the California Wine Market Index™ for the current statewide market signal, key indicators, and additional Market Perspectives.
 California Wine Index