

Official Benchmark Publication
California Wine Market Index™
An Independent Benchmark of California’s Wine-Grape Economy
Publication Date
August 2026
Edition
Release 1.0
Benchmark Base
2000 = 100
Executive Summary
The California Wine Market Index™ (CWMI) provides an independent benchmark for measuring long-term conditions in California’s wine-grape economy. Using verified statewide production and pricing data, the benchmark summarizes overall market performance relative to the base year of 2000 = 100.
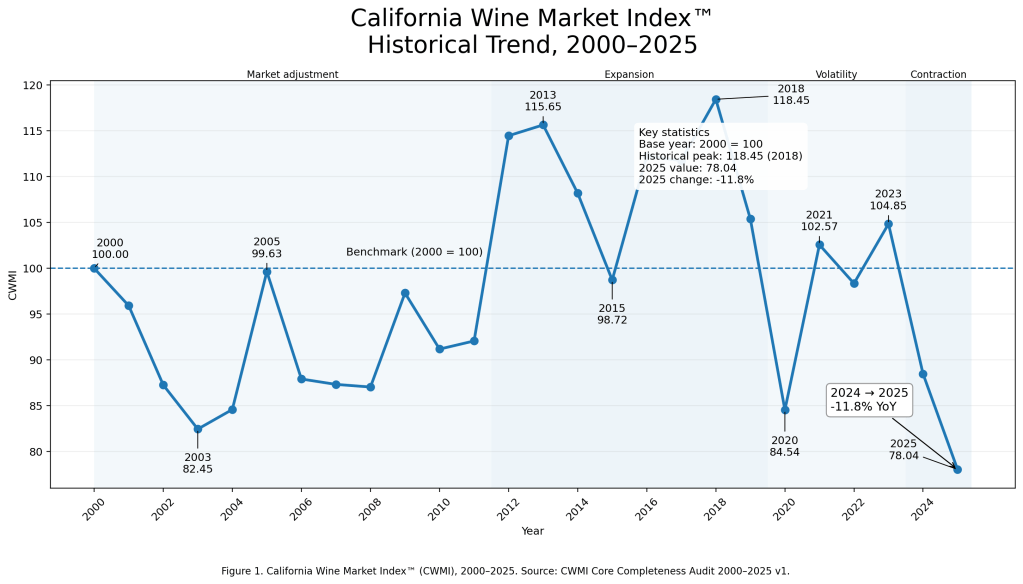
The CWMI closed at 78.04 in 2025, representing an 11.8% decline from the previous year. Lower purchased wine-grape tonnage and weaker statewide grower prices contributed to continued market contraction.
This Annual Report presents the official benchmark results for 2025, historical market trends, benchmark methodology, and supporting analysis for growers, wineries, researchers, lenders, investors, and policymakers.
2025 Market Dashboard
| CWMI | 78.04 |
| Annual Change | −11.8% |
| Purchased Tons | 1,962,614 |
| Avg. Price/Ton | $985.61 |
Historical Market Trend
Figure 1. Historical performance of the California Wine Market Index™ (2000–2025), illustrating major market cycles, benchmark turning points, and the 2025 CWMI value of 78.04.
2025 Market Commentary
A Benchmark Perspective on California’s Wine-Grape Economy
The California Wine Market Index™ (CWMI) closed at 78.04 in 2025, representing an 11.8 percent decline from the previous year and marking the lowest benchmark value recorded in the current 2000–2025 series. The benchmark reflects the combined effects of statewide purchased wine-grape tonnage, weighted average grower prices, and estimated grower revenue, providing a consolidated measure of California’s wine-grape market performance.
Viewed within its historical context, the 2025 benchmark continues the downward adjustment that followed the market peak of 118.45 in 2018. While the historical record demonstrates that the California wine-grape economy has experienced multiple cycles of expansion and contraction, the current benchmark indicates that market conditions remain below the long-term reference level established by the base year of 2000 = 100.
The benchmark does not identify the causes of annual market movements. Instead, it measures the cumulative economic outcomes reflected in verified statewide market data. Climatic variability, changing consumer demand, inventory adjustments, production decisions, export activity, labor availability, and broader economic conditions all influence the benchmark only through their measurable effects on purchased wine-grape tonnage, grower prices, and grower revenue.
Although individual producers, wine regions, and grape varieties may experience conditions that differ from statewide averages, the CWMI provides a consistent reference point for evaluating overall market performance across California’s wine-grape economy. This statewide perspective enables year-to-year comparisons using a stable and transparent methodology that is independent of regional or commercial interests.
The decline recorded in 2025 should therefore be interpreted within the context of the broader historical benchmark rather than as an isolated annual event. The historical series demonstrates that periods of market adjustment have been followed by stabilization and subsequent recovery, underscoring the value of maintaining a long-term benchmark that places annual fluctuations into perspective.
As additional years of verified data are incorporated into the benchmark, the California Wine Market Index™ will provide an increasingly comprehensive historical record of statewide wine-grape market conditions. Future editions of this Annual Report will document subsequent changes in the benchmark while preserving the consistent methodology necessary for meaningful historical comparisons.
Commentary Highlights
2025 CWMI: 78.04
Annual Change: −11.8%
Historical Peak: 118.45 (2018)
Benchmark Base: 2000 = 100
CWMI Insight: Why This Year Matters
The significance of the 2025 benchmark extends beyond the reported value of 78.04. With twenty-six consecutive annual observations beginning in 2000, the California Wine Market Index™ has matured into a meaningful historical benchmark for evaluating long-term changes in California’s wine-grape economy.
While individual annual movements are important, the benchmark’s greatest strength lies in its consistency. Each additional year of verified data enhances the CWMI’s ability to distinguish temporary market fluctuations from broader structural trends. As future observations are added, the benchmark will become an increasingly valuable reference for growers, wineries, lenders, researchers, investors, and policymakers seeking an objective measure of statewide market performance.
Looking Ahead
The California Wine Market Index™ will continue to be updated annually as verified statewide production and pricing data become available. Future reports will extend the historical benchmark series and document changes in California’s wine-grape economy. Maintaining a consistent methodology will allow the CWMI to provide an increasingly valuable long-term reference for evaluating statewide market conditions across changing economic cycles.
About the California Wine Market Index
The California Wine Market Index™ (CWMI) is an independent, data-driven benchmark designed to measure long-term changes in California’s wine-grape economy. Using publicly documented statewide production and pricing data, the CWMI provides a consistent historical reference for growers, wineries, lenders, researchers, investors, and policymakers.
The index is designed as a market benchmark rather than a forecast. It measures changes in statewide wine-grape market performance relative to the benchmark base year of 2000 = 100, allowing annual results to be viewed within a consistent long-term framework.
Data Sources & Methodology
The CWMI is calculated using publicly available statewide data reported through the California Department of Food and Agriculture (CDFA) Grape Crush Report. The benchmark incorporates statewide purchased wine-grape tonnage and weighted average grower prices to measure changes in the economic performance of California’s wine-grape market over time.
Each annual observation is calculated using the same core methodology and compared with the benchmark base year of 2000 = 100. Maintaining a consistent data structure allows changes in market conditions to be compared across years while preserving the integrity of the historical series.
Benchmark Interpretation
A CWMI value of 100 represents the market conditions established in the benchmark year 2000. Values above 100 indicate that the combined statewide market measure is above the benchmark level, while values below 100 indicate performance below that reference level.
The CWMI should be interpreted as a long-term market indicator rather than a prediction of future wine-grape prices or production. Its principal value is the consistent measurement of market movement across time, allowing individual years to be evaluated within a broader historical context.
Publication & Data Notes
Publication: 2025 Annual Report
Publication Date: August 2026
Benchmark Base: 2000 = 100
Current CWMI: 78.04
Annual Change: −11.8%
Historical Peak: 118.45 (2018)
The California Wine Market Index™ is updated annually following the release and review of statewide wine-grape market data. Historical values may be reviewed as additional source documentation becomes available or as part of the continuing data-audit process.
 California Wine Index