California Wine Isn’t One Market. It Just Has One Reputation.
For decades, California wine has been discussed as though it were one coherent economy—usually with premium red grapes standing in for everyone else. Convenient story. Bad accounting.
Take Napa out of the average.
Napa is part of California, so comparing it with the statewide average understates the separation. Remove Napa and the distance between the two markets becomes considerably harder to ignore.
The gap was built over time.
Napa did not simply drift away from California. The premium expanded, compressed and rebuilt through oversupply, recession, drought, wildfire and the present contraction.
Early divergence
California price fell 6.5%. Napa rose 22.9%. Oversupply weakened the broad market while premium pricing separated.
Recovery and segmentation
California volume returned. Napa captured price rather than scale, reinforcing a different economic model.
Crisis compression
Napa was not recession-proof. Its volume and economic weight contracted more sharply than the statewide market.
Rebound and drought pivot
Napa’s price increased 14.5% while the statewide price slipped. Separation began rebuilding.
Premium acceleration
The cleanest expansion in the series: Napa added price and volume while California’s purchased volume declined.
The break
Napa volume fell 41.0% and price fell 20.3%. Smoke damage and pandemic disruption hit the premium market hard.
Rebound and concentration
Napa’s volume recovery—not a widening price multiple—drove its economic share to a new high.
Relative resilience
Napa contracted too. It gained share because California contracted faster—not because Napa grew.
Red still bends the headline.
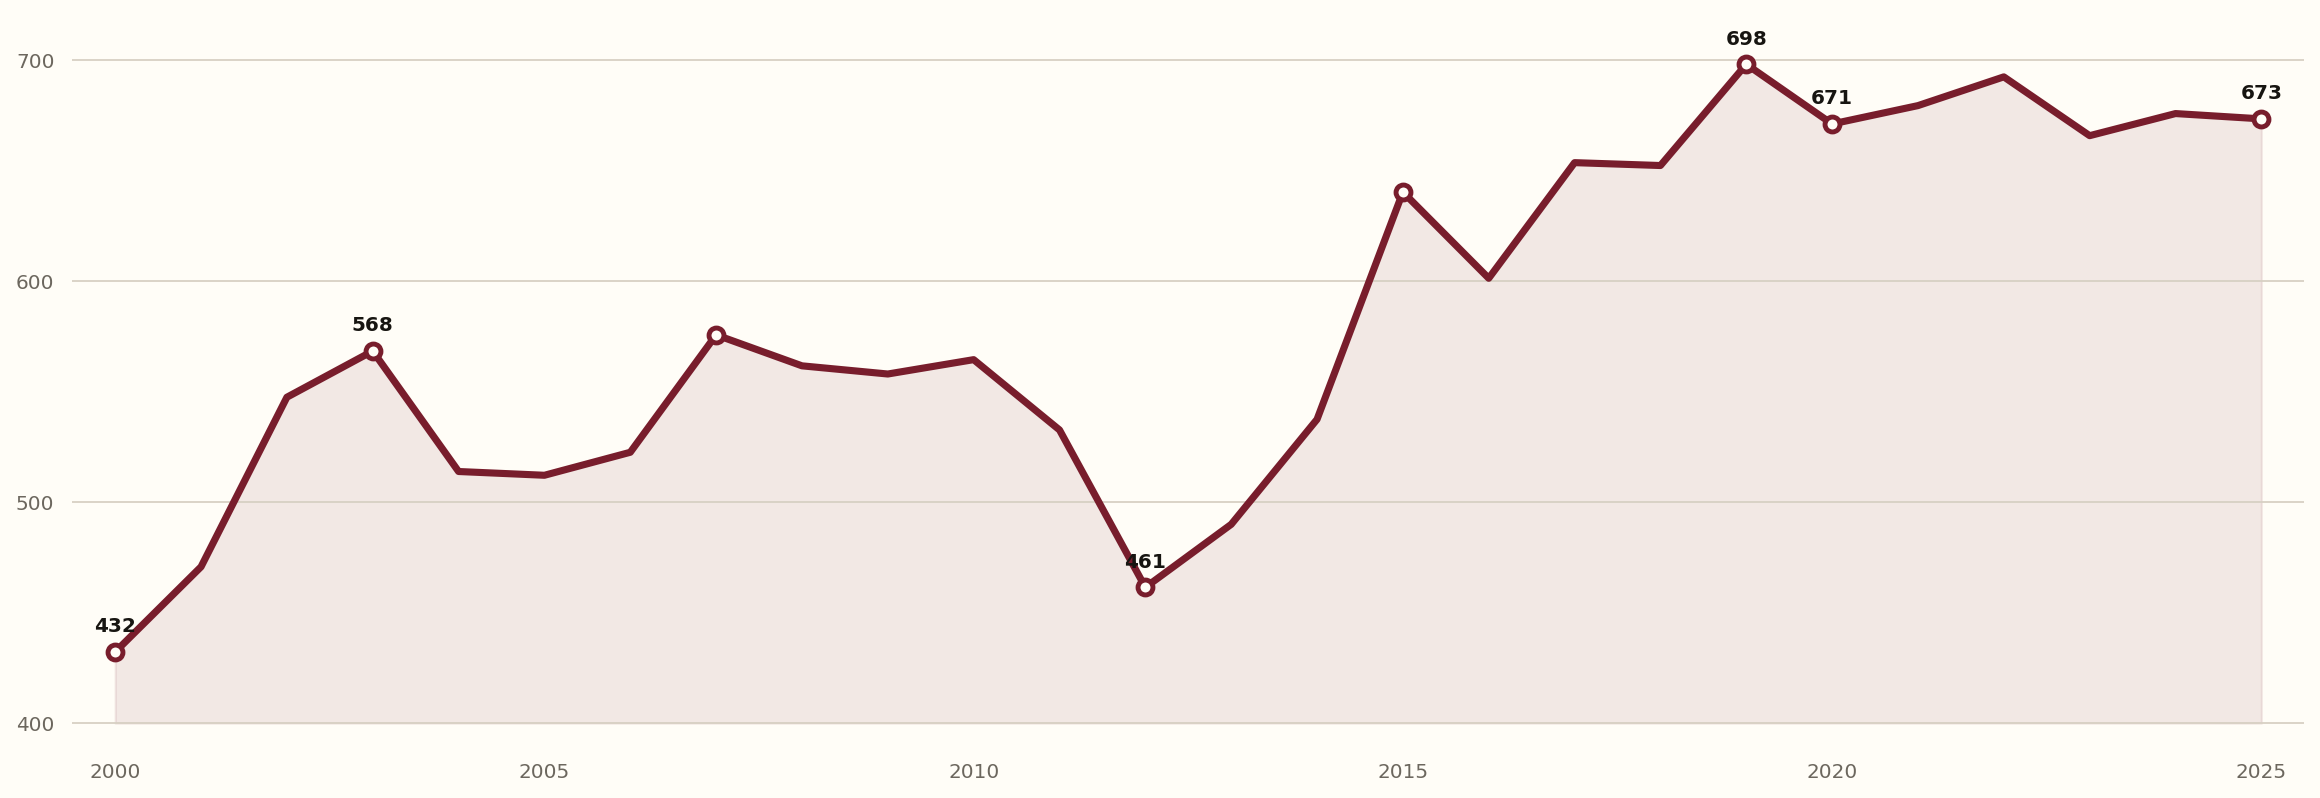
The combined Napa index reflects both geography and grape mix. Napa’s purchased tonnage is more red-heavy than California’s, so the total premium must be read alongside the separate red and white markets.
Napa’s economic engine
Napa red price: $7,632.13 per ton. Napa Red Premium Index: 596.
A different market
Napa white price: $3,458.76 per ton. Napa White Premium Index: 490.
California is plural.
Napa opened the comparison, but it was never the whole case. Sonoma now provides the closest premium coastal counterpoint—similar in reputation, different in market structure, varietal balance and purchasing power. The Central Coast and District 13 will extend the map across premium breadth and interior volume.
| Comparison market | Role in the article | 2025 price | Purchased volume | Calculated value |
|---|---|---|---|---|
| District 4 · Napa | Premium lead case | $6,635.85 | 75,923 | $503.8M |
| District 3 · Sonoma–Marin | Published premium coastal comparison | $2,762.88 | 118,038 | $326.1M |
| Selected Central Coast district | Premium breadth test | Source audit next | Source audit next | Source audit next |
| District 13 · Interior | High-volume price anchor | Source audit next | Source audit next | Source audit next |
| California excluding Napa | Clean economic counterweight | $758.24 | 1,886,690 | $1.431B |
Unaudited district fields remain open until the same Table 4 and Table 6 review used for Napa and Sonoma is complete.
Sonoma’s reputation remains strong. Its purchased-grape economy tells a more complicated story: less volume, diminished purchasing power and a vineyard carrying more than the regional name alone can repay.
Read the Sonoma Brief →A district-by-district examination of where California’s cult wines are made, how geography becomes reputation and what the vineyard market reveals that bottle rankings leave out.

Show the work. Especially the awkward parts.
CWMI does not ask readers to trust the average. We show what went into it, what it leaves out and where the market behaves differently.
Napa is included in California. The article therefore reports both the official statewide comparison and California excluding Napa.
Calculated purchased value equals purchased tons multiplied by weighted grower price. It is not winery revenue or total regional output.
Total Wine is shown beside red and white results so geography is not confused with Napa’s red-heavy purchasing mix.
Recession, drought, wildfire and pandemic events provide context. The article does not claim that timing alone proves causality.
Dollar prices are nominal unless a chart is explicitly labeled inflation-adjusted.
A rising market share during decline is relative resilience—not growth. We say so plainly.
California Wine Isn’t One Market. It Just Has One Reputation.
The markets share shocks. They do not share the same economics. Twenty-six years of purchased volume, price and calculated value make the difference visible.
 California Wine Index